Sunday, October 11, 2026 · Grant Park
Chicago Marathon results
Jenn finished in 3:04:28, improving her Boston personal best by 2:37. The posted result places her in the top 1.95% of women in Chicago’s race-day field.
- Bib
- 18629
- Finish
- 3:04:28
- Chip start
- 7:42:24 AM Central
- PR improvement
- 2:37
- Course
- 26.2 mi, about 210 ft of climb
- Women’s place
- 487 / 24,996
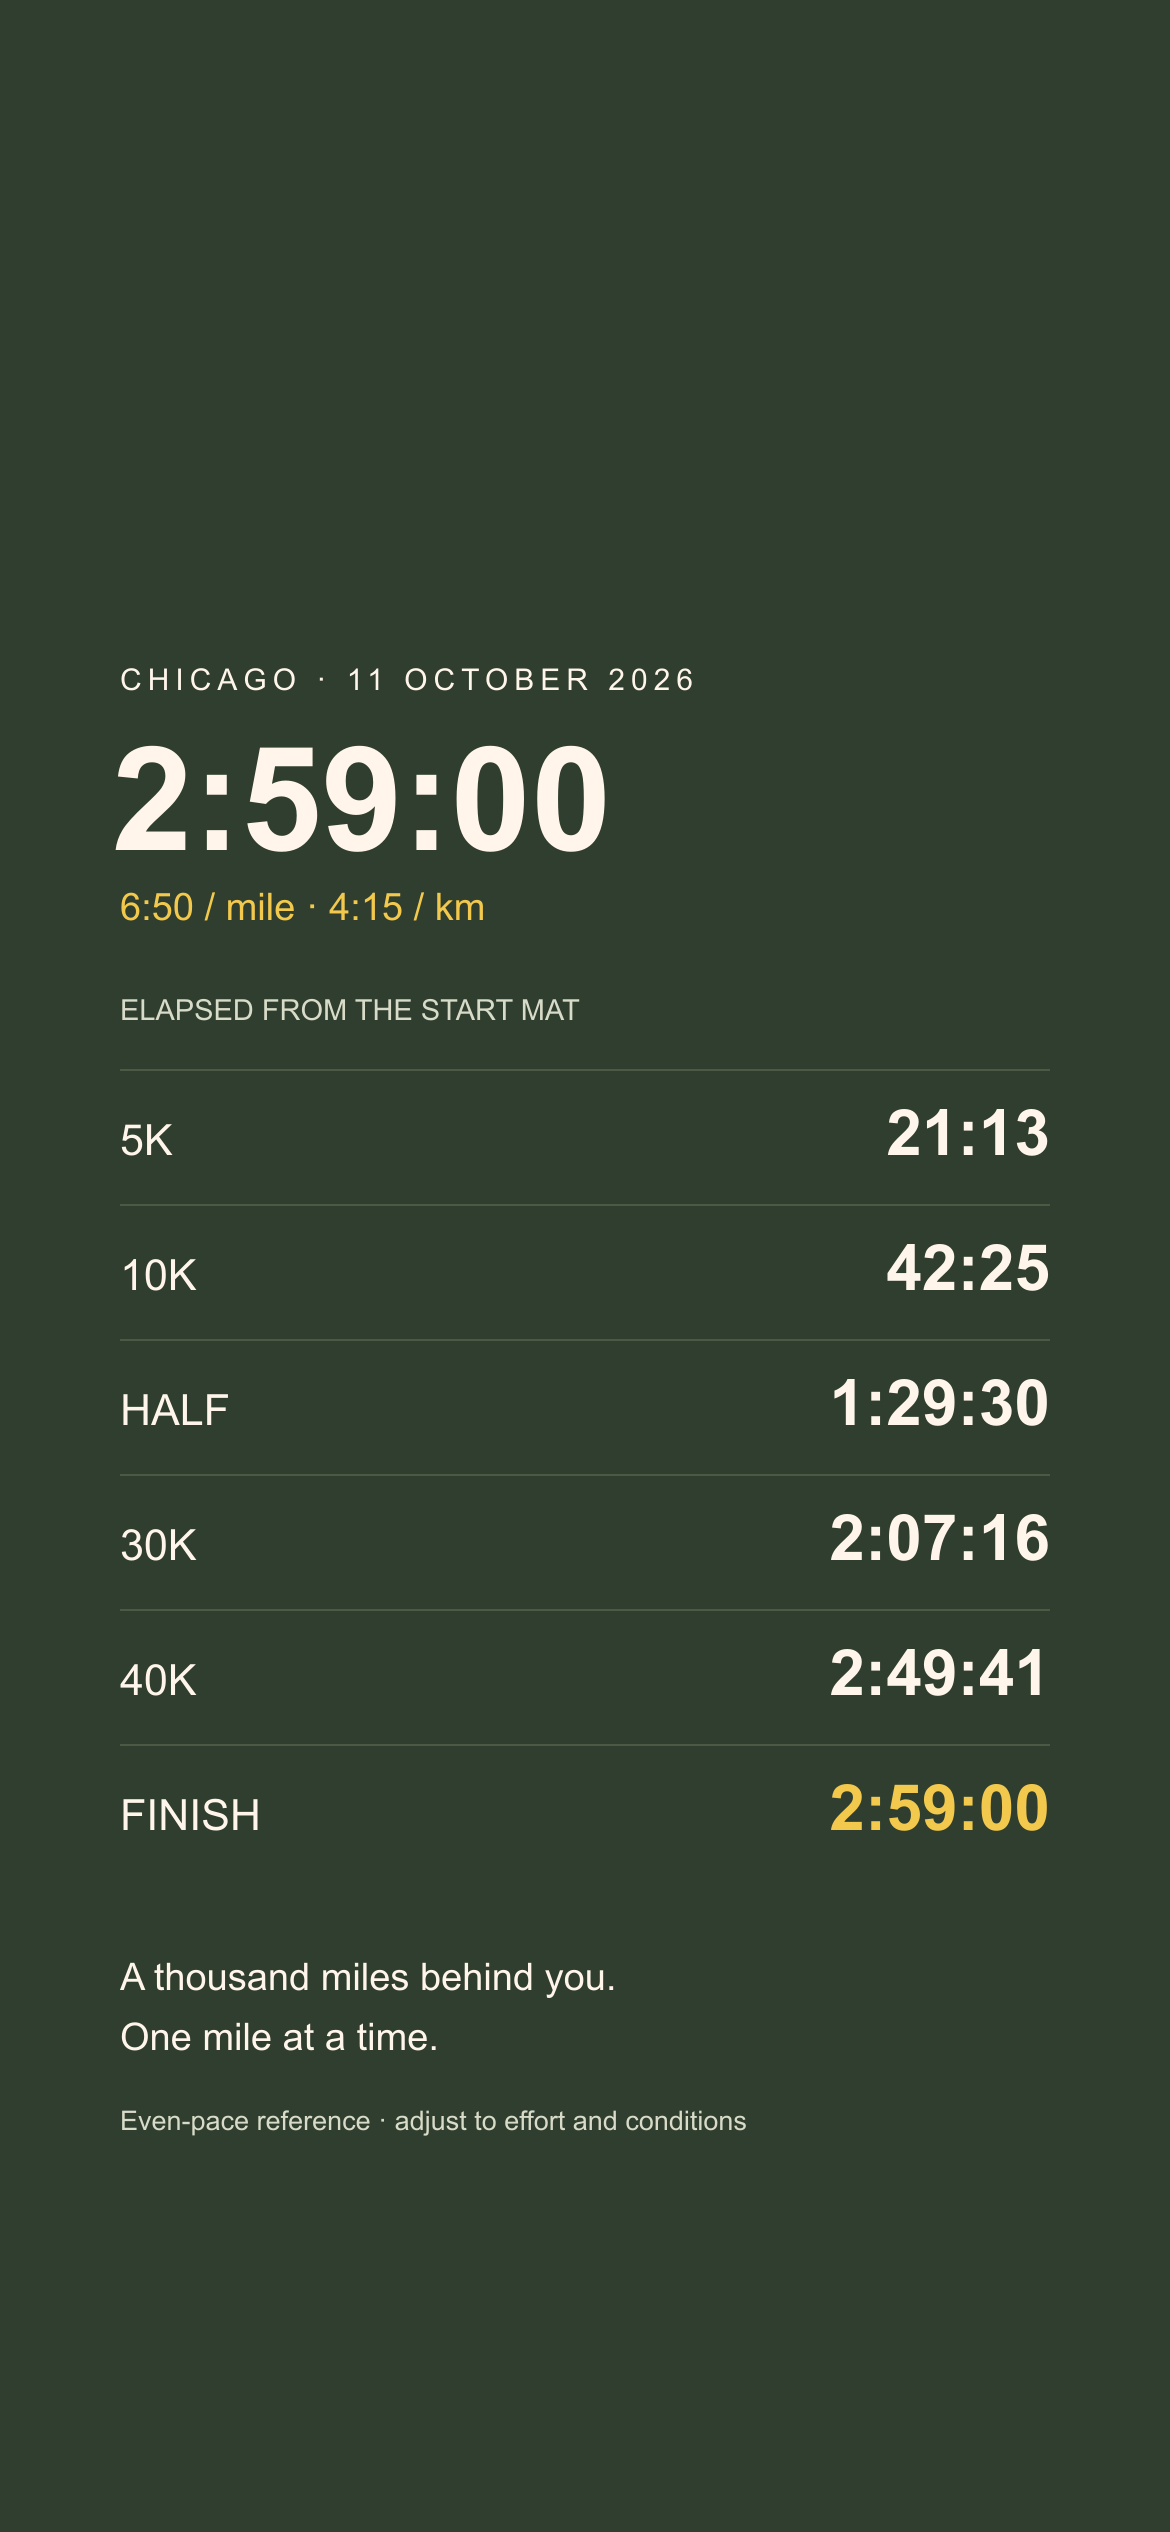
Results are the timing provider’s unofficial race-day posting, checked October 11. The race plan, forecast and map estimates remain archived scenarios.
Placement in the Chicago field
| Field | Place / finishers | Top share | Percentile |
|---|---|---|---|
| Overall | 4,110 / 54,592 | 7.53% | 92.47 |
| Women | 487 / 24,996 | 1.95% | 98.05 |
| Women 25–29 | 157 / 5,608 | 2.80% | 97.20 |
These percentiles compare finishers in the same race-day conditions. Top share is place divided by finishers; percentile is 100 minus that share. Provisional results can change.
The shape of the race
Segment pace at each posted mat (blue), the 2:59 plan (green), and the plan adjusted for the morning's heat as it warmed (dotted). The gap between the two green lines is what the day cost under the model; the gap between blue and the dotted line is pacing.
Read it left to right: the first fifteen kilometres sit below both green lines, which is time borrowed, not banked. From 30K the blue steps climb above the dotted line, which is the loan coming due, and the red step is the mile after the stomach emptied. The last five miles run near 8:00 in 67 to 68°F air with no wind.
| Mat | Chip | Segment | Air | Heat × | Vs plan | Cool-day equiv. |
|---|---|---|---|---|---|---|
| 05K | 19:44 | 6:21 | 59° | 1.026 | −1:52 | 19:14 |
| 10K | 39:59 | 6:31 | 60° | 1.027 | −2:53 | 38:57 |
| 15K | 1:00:41 | 6:40 | 61° | 1.031 | −3:24 | 59:02 |
| 20K | 1:21:54 | 6:50 | 63° | 1.035 | −3:24 | 1:19:32 |
| Half | 1:26:35 | 6:52 | 63° | 1.037 | −3:22 | 1:24:03 |
| 25K | 1:43:25 | 6:56 | 64° | 1.038 | −3:06 | 1:40:16 |
| 30K | 2:05:56 | 7:15 | 64° | 1.039 | −1:48 | 2:01:56 |
| Mile 20 | 2:15:34 | 7:05 | 64° | 1.039 | −1:27 | 2:11:13 |
| Mile 21 | 2:23:04 | 7:30 | 64° | 1.040 | −0:48 | 2:18:25 |
| 35K | 2:29:11 | 8:11 | 65° | 1.042 | +0:11 | 2:24:17 |
| Mile 22 | 2:31:06 | 7:36 | 66° | 1.044 | +0:23 | 2:26:08 |
| Mile 23 | 2:38:56 | 7:50 | 66° | 1.045 | +1:21 | 2:33:37 |
| Mile 24 | 2:46:35 | 7:39 | 67° | 1.047 | +2:09 | 2:40:56 |
| 40K | 2:53:28 | 8:03 | 67° | 1.048 | +3:09 | 2:47:29 |
| Mile 25 | 2:54:37 | 7:56 | 67° | 1.049 | +3:18 | 2:48:35 |
| Mile 25.2 | 2:56:20 | 8:35 | 68° | 1.050 | +3:38 | 2:50:13 |
| Finish | 3:04:28 | 7:59 | 68° | 1.051 | +4:49 | 2:57:58 |
Chip and segment pace are the posted mats. Air is the Midway observation at the segment midpoint. Heat × is this site's weather multiplier for that air, dew point, wind and clear sky; cool-day equivalent divides each segment by it. Vs plan is against the plan set at the top of the page. The shaded row is the segment after mile 21.
The morning, as observed
| Clock | Air | Dew pt | Wind | Sky |
|---|---|---|---|---|
| 7:35 AM | 59° | 52° | 0 mph | Clear |
| 8:00 AM | 59° | 54° | 3 mph | Clear |
| 8:25 AM | 61° | 54° | 7 mph | Clear |
| 9:00 AM | 63° | 54° | 8 mph | Clear |
| 9:30 AM | 64° | 55° | 7 mph | Clear |
| 10:00 AM | 64° | 55° | 3 mph | Clear |
| 10:15 AM | 66° | 55° | 3 mph | Clear |
| 10:45 AM | 68° | 55° | 3 mph | Clear |
Relative humidity read 77 to 82 percent through the first hour, which is what skin registers, because the air was still cool. Sweat evaporation keys on dew point, and 52 to 55°F is moderate; the model charges nothing for it. What it does charge for is full sun from the gun, eight degrees of warming during the race, and a wind that fell to calm after 10 AM, on the exposed Michigan Avenue miles. Source: NWS station KMDW.
The sub-3 question
Three things happened at once. The mats and the thermometer can separate two of them; the third is Jenn's account.
so i couldve run sub 3 on good day i think so i felt great until the second half and threw up at mile 21
Her account and the mats agree on the shape: a first half that felt easy and read 1:26:35, then a second half of 1:37:53. The question is whether a cool day fixes it. Priced rather than guessed:
- Reference class
- 3:04 to 3:06 in heat, prior best near 3:07, positive split over ten minutes
- Prior
- 60%
- Posterior P10 / P50 / P90
- 40 / 62 / 78
- Verdict
- FAVORED, narrowly
- The heat equivalence alone lands near 2:57, which argues for yes.
- The first 15K ran 25 to 30 seconds a mile faster than the plan, which is faster than 2:59 fitness regardless of weather, so a cool day removes part of the fade, not all of it.
- A stomach that empties at mile 21 is partly heat and partly intensity; the cool-day scenario removes the first cause and not the second.
What moves it: A half marathon at or under 1:25 in cool conditions: +15 points. A cool-day marathon opened at 6:50 to 6:55 and held to 20: resolves the question. Repeat GI distress at goal pace in training: -10 points. The posterior is frozen at the date above and resolves only on a cool-day marathon.
Warmth raises the effort a pace costs. The heat guide explains the mechanism and the limits of pace adjustments; the equivalence above applies that same model to the morning's observed conditions and is labelled as a model output, not a measurement.
The synced Strava activity records 20.4 miles and 3:03:20 moving time. That incomplete GPS distance is preserved in the activity feed; the race record uses the measured marathon course and 3:04:28 chip time.